# --- Setup (do not modify) ---
import pandas as pd
import matplotlib.pyplot as plt
# --- Data: PUE values of major cloud providers ---
# Sources: see reference table below
data_centers = {
"Name": [
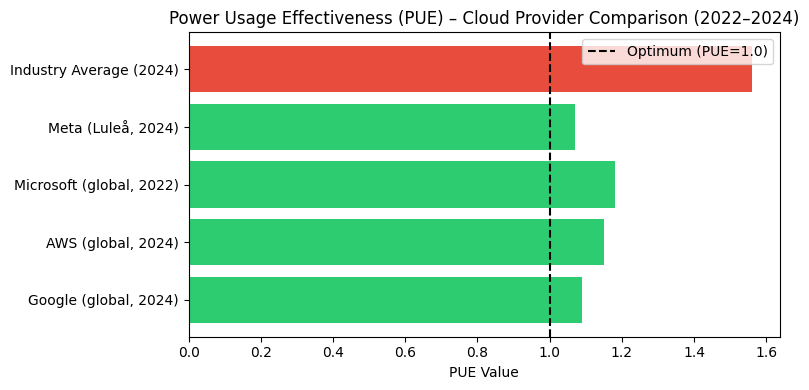
"Google (global, 2024)",
"AWS (global, 2024)",
"Microsoft (global, 2022)",
"Meta (Luleå, 2024)",
"Industry Average (2024)"
],
"PUE": [
1.09, # Google Environmental Report 2025
1.15, # AWS Sustainability Report 2024
1.18, # Microsoft Azure Blog (2022)
1.07, # Meta/DCPulse (Luleå, Sweden)
1.56 # Uptime Institute Survey 2024
]
}
df_dc = pd.DataFrame(data_centers)Green IT Data Visualization Project
In class, the environmental footprint of IT was discussed. There were two key takeaways:
Data centers are responsible for about 1.5% of the global electricity consumption.
Energy efficiency is measured as Power Usage Effectiveness.
(\(\text{PUE}=\frac{total\ power\ consumption\ dc}{power\ consumption\ IT}\))
Learning Objectives
By the end of this project, you will be able to: - Calculate and interpret Power Usage Effectiveness (PUE) metrics - Create professional data visualizations with matplotlib - Analyze trends in global e-waste generation and recycling - Connect data analysis to real-world sustainability challenges
In this notebook, you will calculate PUEs of given companies and visualize (and interpret) E-waste data.
Exercise1: Power Usage Effectiveness (PUE)
Good Visualization Practices
Before you start coding, consider: 1. Clear labels: Always label axes and add a title. 2. Color meaning: Use color to convey information (green = good, red = bad). 3. Reference lines: Add lines for benchmarks (e.g., PUE = 1.0). 4. Legend: Explain what colors or symbols mean.
# TODO 1: Create a horizontal bar chart (barh) of the PUE values.
#
# HINTS:
# - Use df_dc["Name"] for the y-axis labels
# - Use df_dc["PUE"] for the x-axis values
# - To color bars conditionally, create a list:
#   colors = ['green' if pue < 1.2 else 'orange' if pue < 1.4
#             else 'red' for pue in df_dc["PUE"]]
# - Add a vertical line: plt.axvline(x=1.0, color='black',
#   linestyle='--', label='Theoretical Optimum')
# - Don't forget plt.xlabel(), plt.ylabel(), plt.title(), plt.legend()
fig, ax = plt.subplots(figsize=(8, 4))
colors = [
    "#2ecc71" if pue < 1.2
    else "#f39c12" if pue < 1.4
    else "#e74c3c"
    for pue in df_dc["PUE"]
]
ax.barh(df_dc["Name"], df_dc["PUE"], color=colors)
ax.axvline(x=1.0, color="black", linestyle="--",
           label="Optimum (PUE=1.0)")
ax.set_xlabel("PUE Value")
ax.set_title("Power Usage Effectiveness (PUE) "
             "– Cloud Provider Comparison (2022–2024)")
ax.legend()
plt.tight_layout()
plt.show()
Exercise 2: E-Waste Analysis
# --- Data: Global e-waste ---
# Source: Global E-Waste Monitor 2024
# (UNITAR/ITU), including projections
data_ewaste = {
    "Year": [
        2010, 2014, 2019, 2022, 2030
    ],
    "E_Waste_Million_Tonnes": [
        34.0, 41.8, 53.6, 62.0, 82.0
    ],
    "Recycled_Percent": [
        23.5, 22.5, 17.4, 22.3, 20.0
    ]
}
df_ew = pd.DataFrame(data_ewaste)

# TODO 2: Create a line chart with two y-axes: e-waste
# (million tonnes) on the left axis and recycling rate (%)
# on the right axis, over time.
#
# HINTS:
# - Use plt.plot() for both lines
# - For the second y-axis: ax2 = ax1.twinx()
# - Mark 2030 as a projection using a dashed line or different
#   marker (e.g., linestyle='--' for years >= 2030, or use
#   plt.axvline(x=2030, linestyle=':', label='Projection'))
# - Label both y-axes: ax1.set_ylabel("..."),
#   ax2.set_ylabel("...")
# - Add a legend: ax1.legend(loc='upper left'),
#   ax2.legend(loc='upper right')


# TODO 3:
# (a) Calculate unrecycled e-waste in 2022:
#     unrecycled_tonnes = total_2022 * (1 - recycled_percent / 100)
#
# (b) Calculate value of unrecycled materials:
#     If total value = USD 62 bn and recycling rate = 22.3%,
#     then unrecycled value = 62 * (1 - 0.223) billion USD
#
# Print both results.
References
| Organization | Report/Source | Year |
|---|---|---|
| Environmental Report 2025 | 2025 | |
| AWS | Sustainability Report 2024 | 2024 |
| Microsoft | Azure Blog (PUE Metrics) | 2022 |
| Meta | DCPulse (Luleå Data Center) | 2024 |
| Uptime Institute | Global Data Center Survey | 2024 |
| UNITAR/ITU | Global E-Waste Monitor 2024 | 2024 |
Links: - Google: https://sustainability.google/reports/ - AWS: https://sustainability.aboutamazon.com/ - Microsoft: https://azure.microsoft.com/en-us/blog/ - Meta: https://sustainability.fb.com/ - Uptime Institute: https://uptimeinstitute.com/ - UNITAR: https://ewastemonitor.info/